INTERACTIVE WORLD MONTHLY AVERAGE TEMPERATURE LOOKER STUDIO DASHBOARD
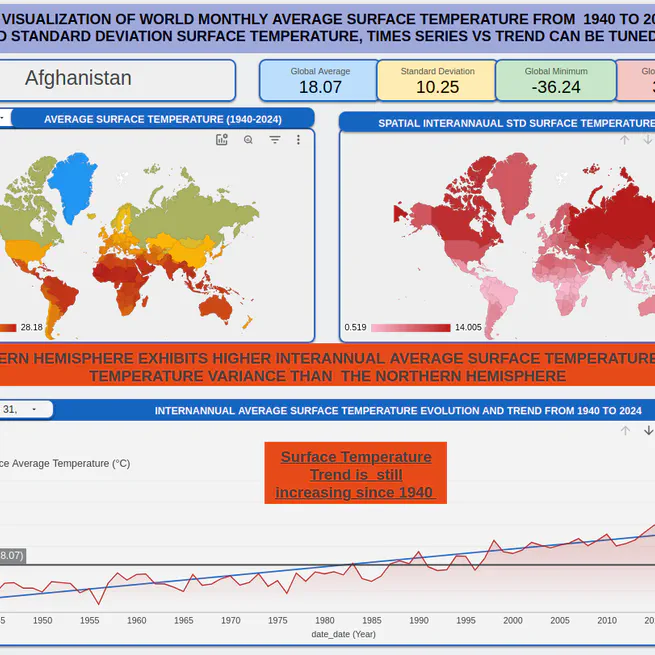
Using Looker Studio visualization tools, I created the following interactive world monthly average temperature dashboard which shows the spatial distribution of interannual average and standard deviation of surface temperature. The dataset is from Kaggle over the period 1940 to 2024
The dashboard provides: A geospatial chart that shows the evolution of interannual average temperature on the left and the standard deviation on the right. A country control dropdown button offers the opportunity to select a specific country. A specific country information can also be accessed by clicking directly on the map.
The bottom graph shows average surface temperature time series and trend over the period 1940 to 2024 for selected country. A Date range control button permit to select a range date to consider for analysis. There is a possibility to drill down on the month quarter average, and on the month average.
Feel Free to provide a feedback or for a questions at fidel999@yahoo.fr.
Mar 26, 2025