Here are a selection of projects that I have worked on over the years.
The flood_mapper package is a Python-based tool designed for rapid and flexible mapping of flooded areas using Google Earth Engine (GEE). It leverages pre- and post-event satellite imagery from Sentinel-1 (Synthetic Aperture Radar - SAR) and Sentinel-2 (optical) to detect flood extents. The package offers users the flexibility to choose their preferred detection method and handles data ingestion, preprocessing, flood detection, and export of results to Google Earth Engine Assets.
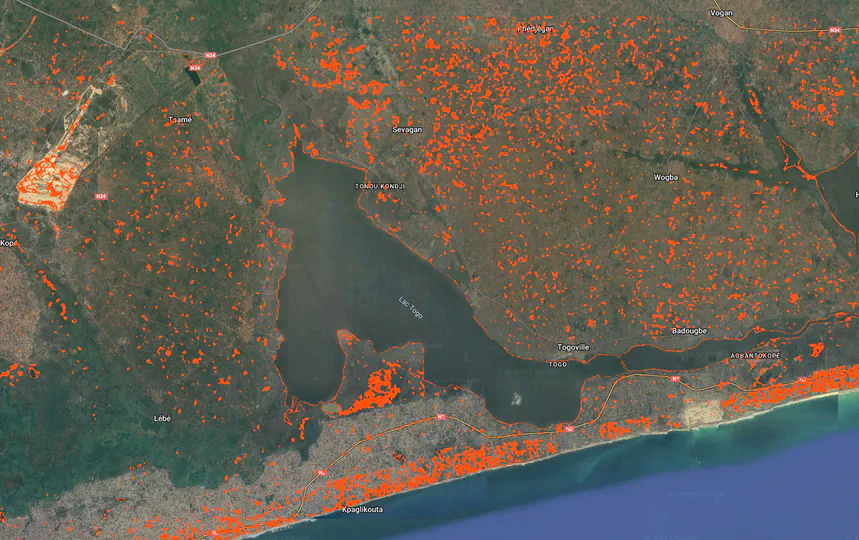
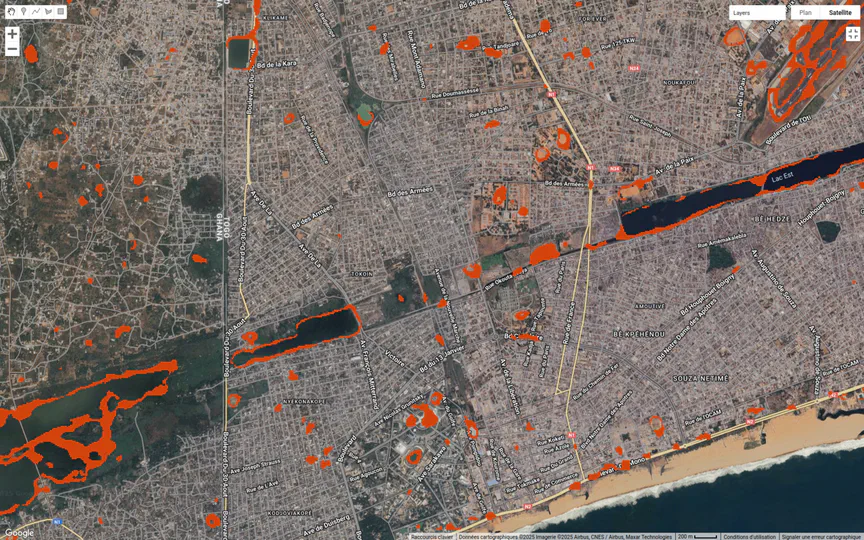
In the early hours of May 26th, 2024, residents across Lomé awoke to a city transformed. Streets once bustling with life had turned into rushing canals. Markets stood silent, their stalls submerged. For thousands, homes became islands—or worse, were swept away entirely. The city had been overwhelmed by relentless rainfall, causing widespread flooding and plunging vulnerable communities into chaos. This personal investigation leverages Synthetic Aperture Radar (SAR) imagery from the Sentinel-1 satellite to map and assess the extent of this disaster. By comparing pre- and post-flood scenes, and integrating slope data from Digital Elevation Models (DEMs), this study provides a clear, data-driven view of how water reshaped the urban landscape of Lomé. Beyond capturing a moment of crisis, the project demonstrates how satellite data can inform risk assessment, guide urban planning, and ultimately support more resilient futures—especially for cities like Lomé, where the stakes grow higher with every season.
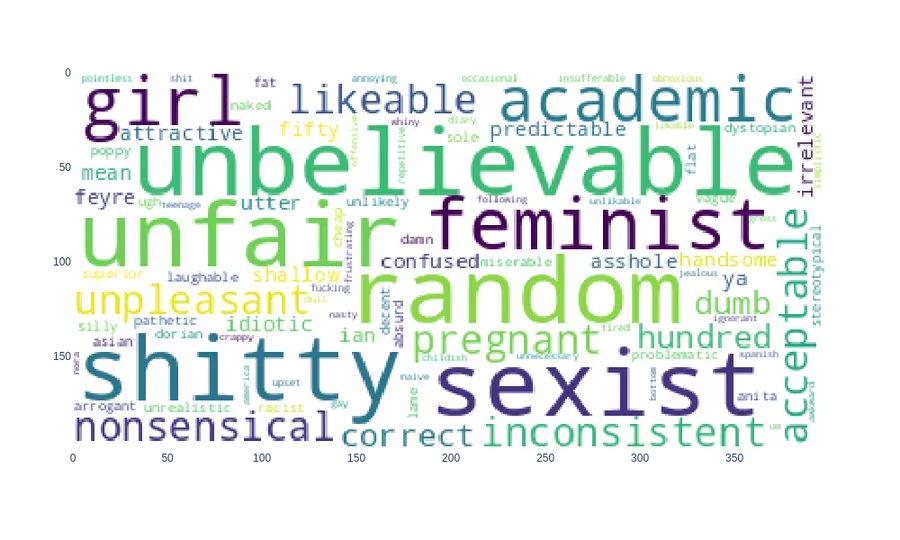
Project Summary: What Drives Book Review Ratings? In this project, I explored what really influences book review ratings—beyond the surface-level likes and word counts. Using NLP, sentiment analysis, and causal inference modeling, I analyzed thousands of reader reviews to see if factors like review length, sentiment, follower count, and likes actually predict star ratings. Surprisingly, the data showed no strong causal link between these variables and the ratings themselves. Instead, the tone and content of the reviews revealed a deeper truth: 5-star reviews radiated joy and admiration, while 1-star ones were packed with frustration and confusion. The takeaway? Star ratings may reflect more of a reviewer’s personal style than social signals. Sometimes, it’s not what you say—but how passionately (or dramatically) you say it.
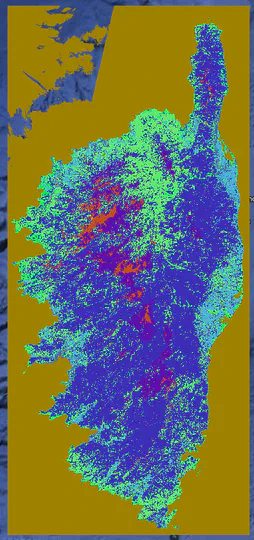
Supervised landcover classification Comparison of 2 supervised models for Land cover use classification from Sentinel 2 imagery over Corse region. ee.Classifier.smileRandomForest() - An ensemble learning method that builds multiple decision trees and aggregates their predictions through majority voting. ee.Classifier.libsvm() - Support Vector Machine (SVM) using LIBSVM library : A powerful supervised learning algorithm that finds the optimal hyperplane to separate different classes in a high-dimensional feature space. It can use various kernel functions (e.g., linear, radial basis function (RBF), polynomial) to handle non-linear relationships. In many geospatial land cover classification studies, Random Forest has become a popular and often highly effective choice due to its balance of accuracy, efficiency, and ease of use. However, SVM can also be a strong contender, especially when dealing with complex spectral signatures and with careful parameter optimization. Core techs skills: Platform: Google Earth Engine (GEE) Imagery Data: Sentinel-2 Primary Programming Language: Python Python : geemap, ee Development Environment: google colab Results: In this project, model evaluation has shows that the Random Forest model provides the best perfomance of 73% over SVM (66%).
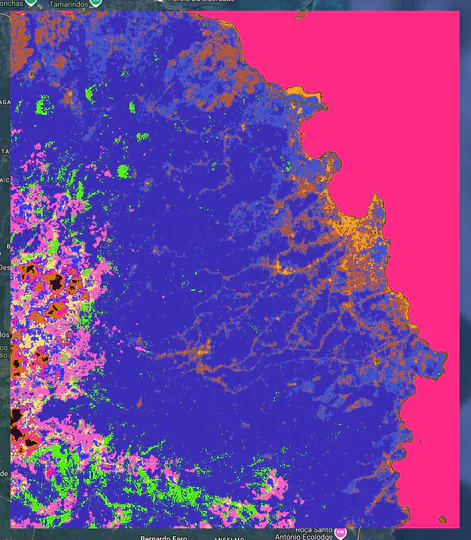
Unsupervised sentinel-2 imagery Classification Unsupervised Sentinel 2 imagery land cover classification using GEE and geemap package Two clustering methods have been tested: Method 1 : Xmeans X-Means extends the K-Means clustering algorithm by efficiently estimating the optimal number of clusters within a specified range. The algorithm iteratively evaluates potential cluster splits using a Bayesian Information Criterion (BIC) to determine the most likely number of clusters. Users can customize parameters like the minimum and maximum number of clusters, iterations, distance function, and randomization seed for fine-grained control over the clustering process. Implemented within Earth Engine, X-Means offers a scalable solution for geospatial data analysis and pattern recognition tasks. Method 2: LVQ The algorithm learns by adjusting cluster prototypes based on the input data during training epochs. LVQ learns a set of codebook vectors (prototypes) that represent clusters in the data. It assigns each data point to the cluster whose prototype is most similar. The prototypes are adjusted iteratively based on training data (even in unsupervised mode, it needs training samples to define the initial prototypes). Discussions: LVQ is potentially better at defining complex cluster shapes. Unlike X-means,LVQ isn’t strictly tied to spherical clusters. It can adapt to more irregular cluster boundaries depending on the distribution of the training data. K-means-based algorithms are generally efficient for large datasets like satellite imagery and offers the ability to automatically estimates the number of clusters. A significant advantage over LVQ and standard K-means is its ability to determine a suitable number of clusters from the data, which can be very useful when the exact number of land cover types is unknown beforehand. XMeans model LVQ model