Flood Mapper Package
The flood_mapper package is a Python-based tool designed for rapid and flexible mapping of flooded areas using Google Earth Engine (GEE). It leverages pre- and post-event satellite imagery from Sentinel-1 (Synthetic Aperture Radar - SAR) and Sentinel-2 (optical) to detect flood extents. The package offers users the flexibility to choose their preferred detection method and handles data ingestion, preprocessing, flood detection, and export of results to Google Earth Engine Assets.
Jul 16, 2025
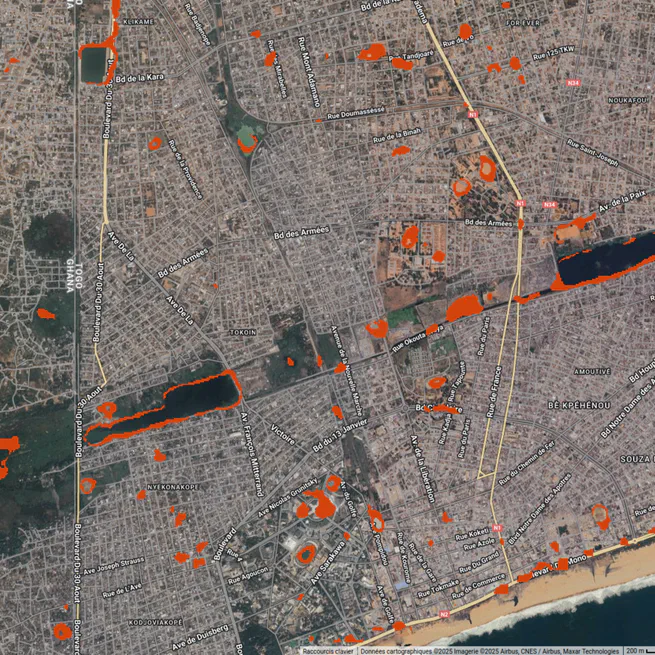
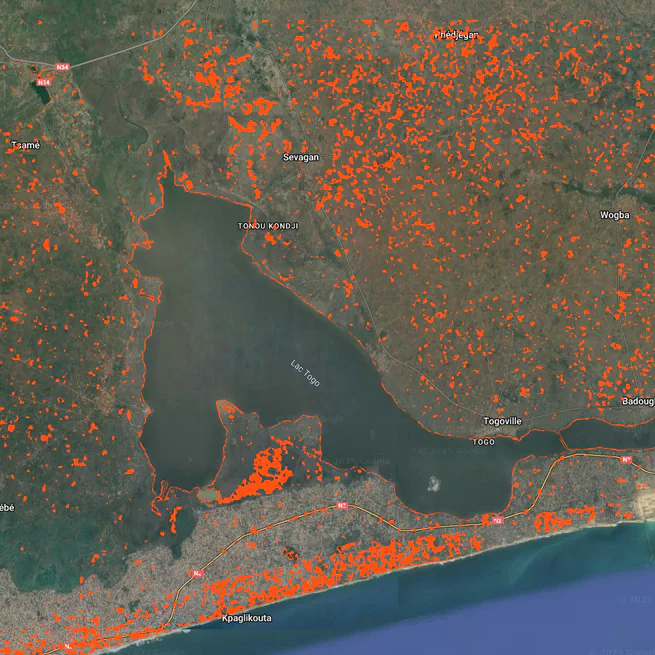
Mapping the Invisible: Flood Impact Analysis over Lomé (May 2024)
In the early hours of May 26th, 2024, residents across Lomé awoke to a city transformed. Streets once bustling with life had turned into rushing canals. Markets stood silent, their stalls submerged. For thousands, homes became islands—or worse, were swept away entirely. The city had been overwhelmed by relentless rainfall, causing widespread flooding and plunging vulnerable communities into chaos. This personal investigation leverages Synthetic Aperture Radar (SAR) imagery from the Sentinel-1 satellite to map and assess the extent of this disaster. By comparing pre- and post-flood scenes, and integrating slope data from Digital Elevation Models (DEMs), this study provides a clear, data-driven view of how water reshaped the urban landscape of Lomé. Beyond capturing a moment of crisis, the project demonstrates how satellite data can inform risk assessment, guide urban planning, and ultimately support more resilient futures—especially for cities like Lomé, where the stakes grow higher with every season.
May 30, 2025
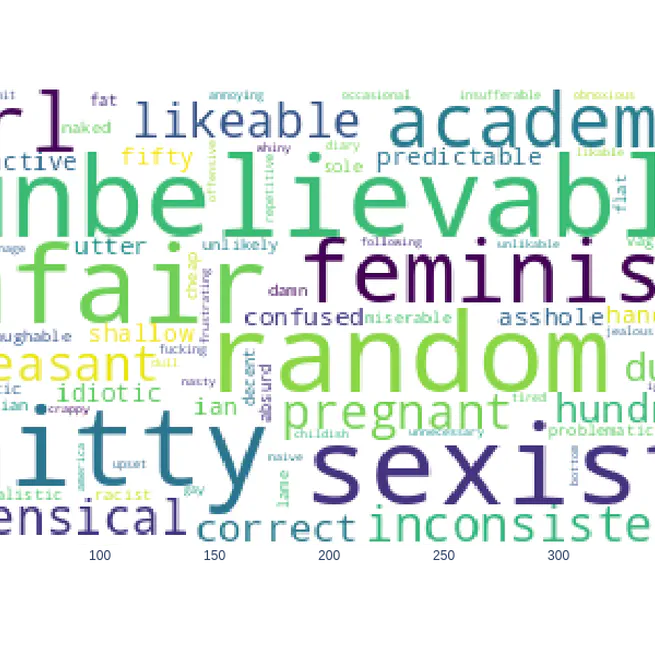
Books reviewers review rating Analysis
Project Summary: What Drives Book Review Ratings? In this project, I explored what really influences book review ratings—beyond the surface-level likes and word counts. Using NLP, sentiment analysis, and causal inference modeling, I analyzed thousands of reader reviews to see if factors like review length, sentiment, follower count, and likes actually predict star ratings. Surprisingly, the data showed no strong causal link between these variables and the ratings themselves. Instead, the tone and content of the reviews revealed a deeper truth: 5-star reviews radiated joy and admiration, while 1-star ones were packed with frustration and confusion. The takeaway? Star ratings may reflect more of a reviewer’s personal style than social signals. Sometimes, it’s not what you say—but how passionately (or dramatically) you say it.
May 26, 2025
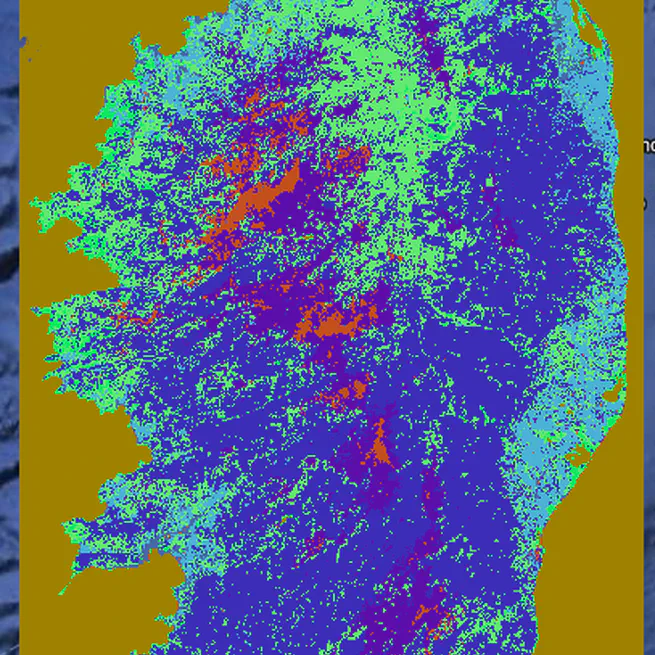
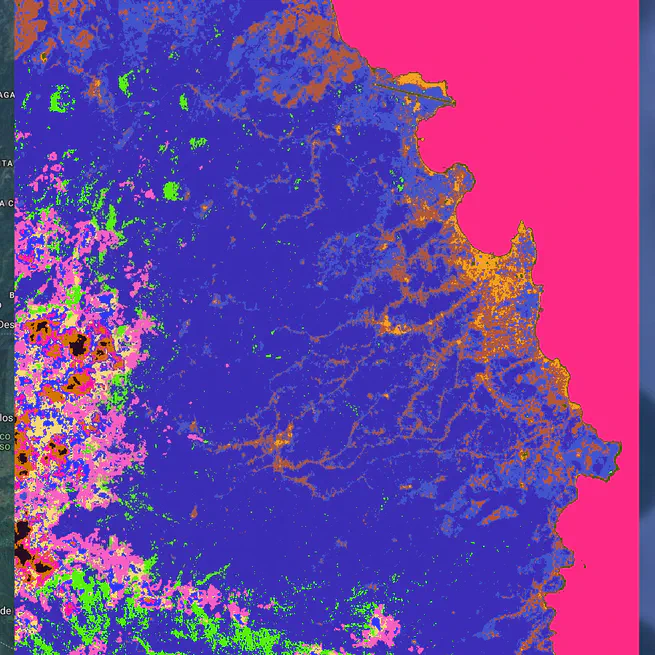
Supervised Landcover Classification of Sentinel2 imagery over Corse region
Supervised landcover classification Comparison of 2 supervised models for Land cover use classification from Sentinel 2 imagery over Corse region. ee.Classifier.smileRandomForest() - An ensemble learning method that builds multiple decision trees and aggregates their predictions through majority voting. ee.Classifier.libsvm() - Support Vector Machine (SVM) using LIBSVM library : A powerful supervised learning algorithm that finds the optimal hyperplane to separate different classes in a high-dimensional feature space. It can use various kernel functions (e.g., linear, radial basis function (RBF), polynomial) to handle non-linear relationships. In many geospatial land cover classification studies, Random Forest has become a popular and often highly effective choice due to its balance of accuracy, efficiency, and ease of use. However, SVM can also be a strong contender, especially when dealing with complex spectral signatures and with careful parameter optimization. Core techs skills: Platform: Google Earth Engine (GEE) Imagery Data: Sentinel-2 Primary Programming Language: Python Python : geemap, ee Development Environment: google colab Results: In this project, model evaluation has shows that the Random Forest model provides the best perfomance of 73% over SVM (66%).
May 10, 2025
Unsupervised sentinel-2 imagery Classification
Unsupervised sentinel-2 imagery Classification Unsupervised Sentinel 2 imagery land cover classification using GEE and geemap package Two clustering methods have been tested: Method 1 : Xmeans X-Means extends the K-Means clustering algorithm by efficiently estimating the optimal number of clusters within a specified range. The algorithm iteratively evaluates potential cluster splits using a Bayesian Information Criterion (BIC) to determine the most likely number of clusters. Users can customize parameters like the minimum and maximum number of clusters, iterations, distance function, and randomization seed for fine-grained control over the clustering process. Implemented within Earth Engine, X-Means offers a scalable solution for geospatial data analysis and pattern recognition tasks. Method 2: LVQ The algorithm learns by adjusting cluster prototypes based on the input data during training epochs. LVQ learns a set of codebook vectors (prototypes) that represent clusters in the data. It assigns each data point to the cluster whose prototype is most similar. The prototypes are adjusted iteratively based on training data (even in unsupervised mode, it needs training samples to define the initial prototypes). Discussions: LVQ is potentially better at defining complex cluster shapes. Unlike X-means,LVQ isn’t strictly tied to spherical clusters. It can adapt to more irregular cluster boundaries depending on the distribution of the training data. K-means-based algorithms are generally efficient for large datasets like satellite imagery and offers the ability to automatically estimates the number of clusters. A significant advantage over LVQ and standard K-means is its ability to determine a suitable number of clusters from the data, which can be very useful when the exact number of land cover types is unknown beforehand. XMeans model LVQ model
May 3, 2025
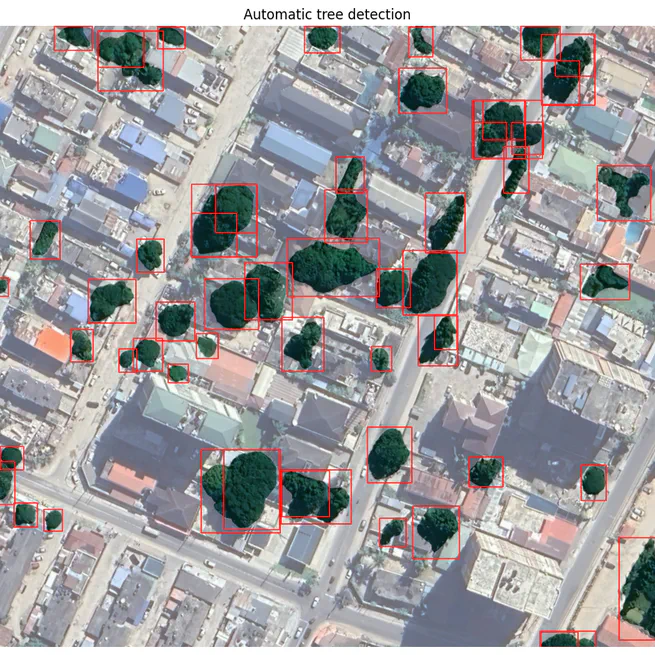
Object detection in satellite imagery using CNN and SAM algorithms
This Google Colab notebook demonstrates an automated approach for detecting individual trees in satellite imagery. It leverages the power of a Convolutional Neural Network (CNN) for feature extraction, enhanced by the precise segmentation capabilities of the Segment Anything Model (SAM). By integrating these advanced deep learning techniques with the geospatial processing capabilities of the leafmap library, this project enables users to accurately identify and locate trees within user-defined regions of interest. Core Technical Skills: Convolutional Neural Networks (CNNs): Mentioning experience or application of CNNs for feature extraction or object detection. Segment Anything Model (SAM): Highlighting the use and understanding of sophisticated segmentation algorithms like SAM. Satellite Imagery Analysis: Indicating proficiency in working with and analyzing data from satellite sources. Geospatial Data Processing: Demonstrating skills in handling and manipulating geospatial data. Python Programming: Essential for implementing the project. Deep Learning: A broader understanding of deep learning concepts and techniques. Image Segmentation: Specifically mentioning skills in segmenting objects within images. Object Detection: The overarching goal of the project. leafmap Library: Experience with using the leafmap library for geospatial tasks. Results: The figure suggests that the automatic tree detection algorithm has successfully identified a significant number of individual trees within the scene. The red bounding boxes appear to closely encapsulate the visible tree canopies.
May 2, 2025
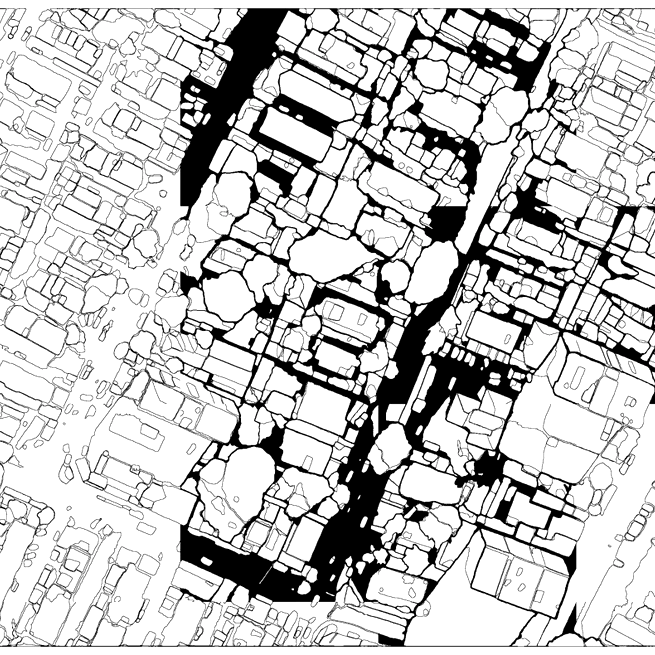
Segmentation of Satellite Imagery using CNNs and SAM
Segmentation of Satellite Imagery using CNNs and SAM The goal of this Google Colab project is to accurately automatically segment a satellite imagery. To achieve this, a Convolutional Neural Network (CNN) is employed in conjunction with the Segment Anything Model (SAM), a sophisticated segmentation algorithm known for its strong performance. This Python-based implementation utilizes the leafmap library to handle and process the geospatial data, allowing users to select specific regions of interest for analysis. The algorithm has demonstrated its effectiveness in segmenting the differents objects mainly buildings. # Make sure you use GPU runtime for this notebook. For Google Colab, go to Runtime -> Change runtime type and select GPU as the hardware accelerator. Core Technical Skills: Convolutional Neural Networks (CNNs): For object detection tasks. Segment Anything Model (SAM): For advanced image segmentation. Image Segmentation Algorithms: Demonstrates understanding of the underlying techniques. Object Detection: The primary task being addressed. Geospatial Data Analysis: Working with satellite imagery. Python Programming: The primary language used. Tools & Libraries: Google Colab: The development environment. leafmap: For geospatial data handling and visualization in Colab. Deep Learning Frameworks (Implicit): While not explicitly stated, it’s implied you’re using a framework like TensorFlow or PyTorch with CNNs. You could mention this if you want to be more specific (e.g., “TensorFlow/PyTorch”). Conceptual Understanding: Region of Interest (ROI) Analysis: The ability to focus on specific areas. Remote Sensing: Understanding of satellite imagery and its applications.
Apr 30, 2025

Bank customer Churn Analysis
Predicting customer churn in a bank thank to Machine Learning Interpretation Exited: Whether the customer has churned (1 = yes, 0 = no) The model shows an accuracy of 81% which is a good performance of the model The precision shows that out of all the customer that the model predicted would churned, only 66% actually did. The recall shows that out of all the customers that actually did churned, the model only predicted this outcome correctly for 19% of those customers. The f1-score shows that the model does a good job of predicting the unchurned customers. The support : we have 1581 of class 0 and 419 of class 1, which is a really unbalanced dataset. Overall, this classifier or model is better to find class 0 over class 1. That is not in accordance of our goal to better predict a bank customer churn.
Apr 22, 2025
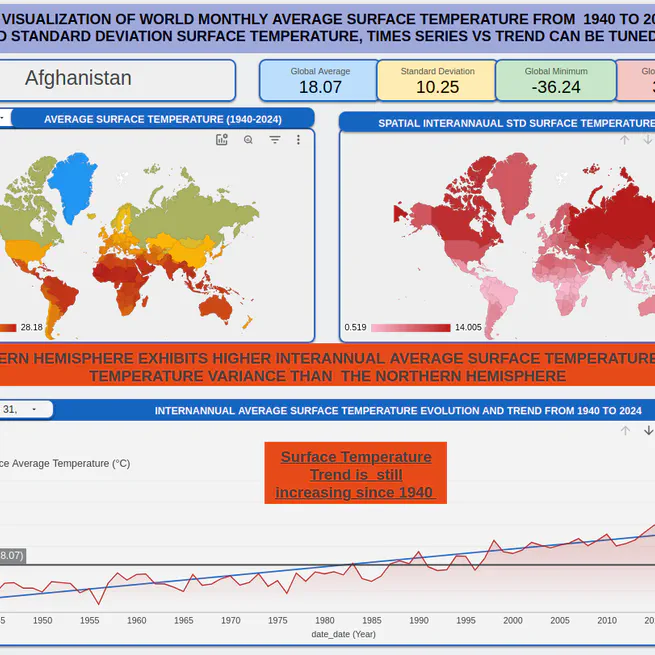
INTERACTIVE WORLD MONTHLY AVERAGE TEMPERATURE LOOKER STUDIO DASHBOARD
Using Looker Studio visualization tools, I created the following interactive world monthly average temperature dashboard which shows the spatial distribution of interannual average and standard deviation of surface temperature. The dataset is from Kaggle over the period 1940 to 2024 The dashboard provides: A geospatial chart that shows the evolution of interannual average temperature on the left and the standard deviation on the right. A country control dropdown button offers the opportunity to select a specific country. A specific country information can also be accessed by clicking directly on the map. The bottom graph shows average surface temperature time series and trend over the period 1940 to 2024 for selected country. A Date range control button permit to select a range date to consider for analysis. There is a possibility to drill down on the month quarter average, and on the month average. Feel Free to provide a feedback or for a questions at fidel999@yahoo.fr.
Mar 26, 2025